Vinayak Sharma, Tristan Thomas, Sam Ghaliyini
The aim for this project was to build out a recursive nueral network that would be able to learn historic stock data, and then be able to predict the future of the stock price up to some number of days. We embarked upon this project using raw data from YahooFinance. We used all of the variables from the raw data, such as open, low, high, close, volume etc. We also created 2 features that would be found algorithmically to feed to the RNN. These features are MACD and Resistance and Support (organized into buckets). To prepare a matrix for our RNN we created 2 separate super-algorithms with sub-algorithms within them. The first dataframe is extracted from the Yahoo Finance suite inside python. This initial dataframe can be pushed forward as an input into our MACD function. The MACD function outputs a Dataframe which is the initial DataFrame appended with 2 MACD columns(rolling and exponential). The output DataFrame from MACD is then used as an input for a Support and Resistance function. This function outputs a DataFrame with another appended column containing support and resistance data anda final column containing euclidean distances from the peaks and valleys. This Final DataFrame will be used in our RNN. We runn a RNN with multiple hidden LSTM layers using this dataframe to predict the future movement of the stock.
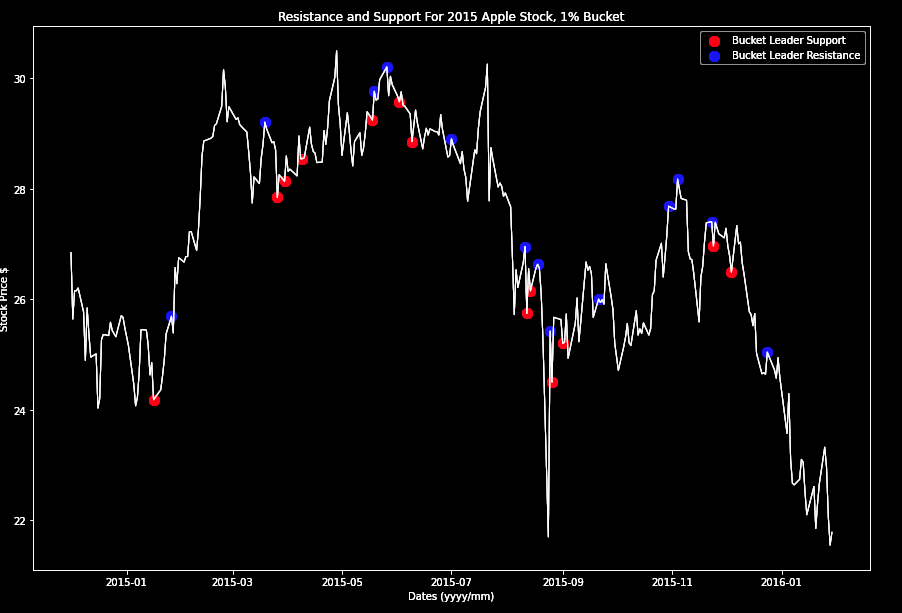
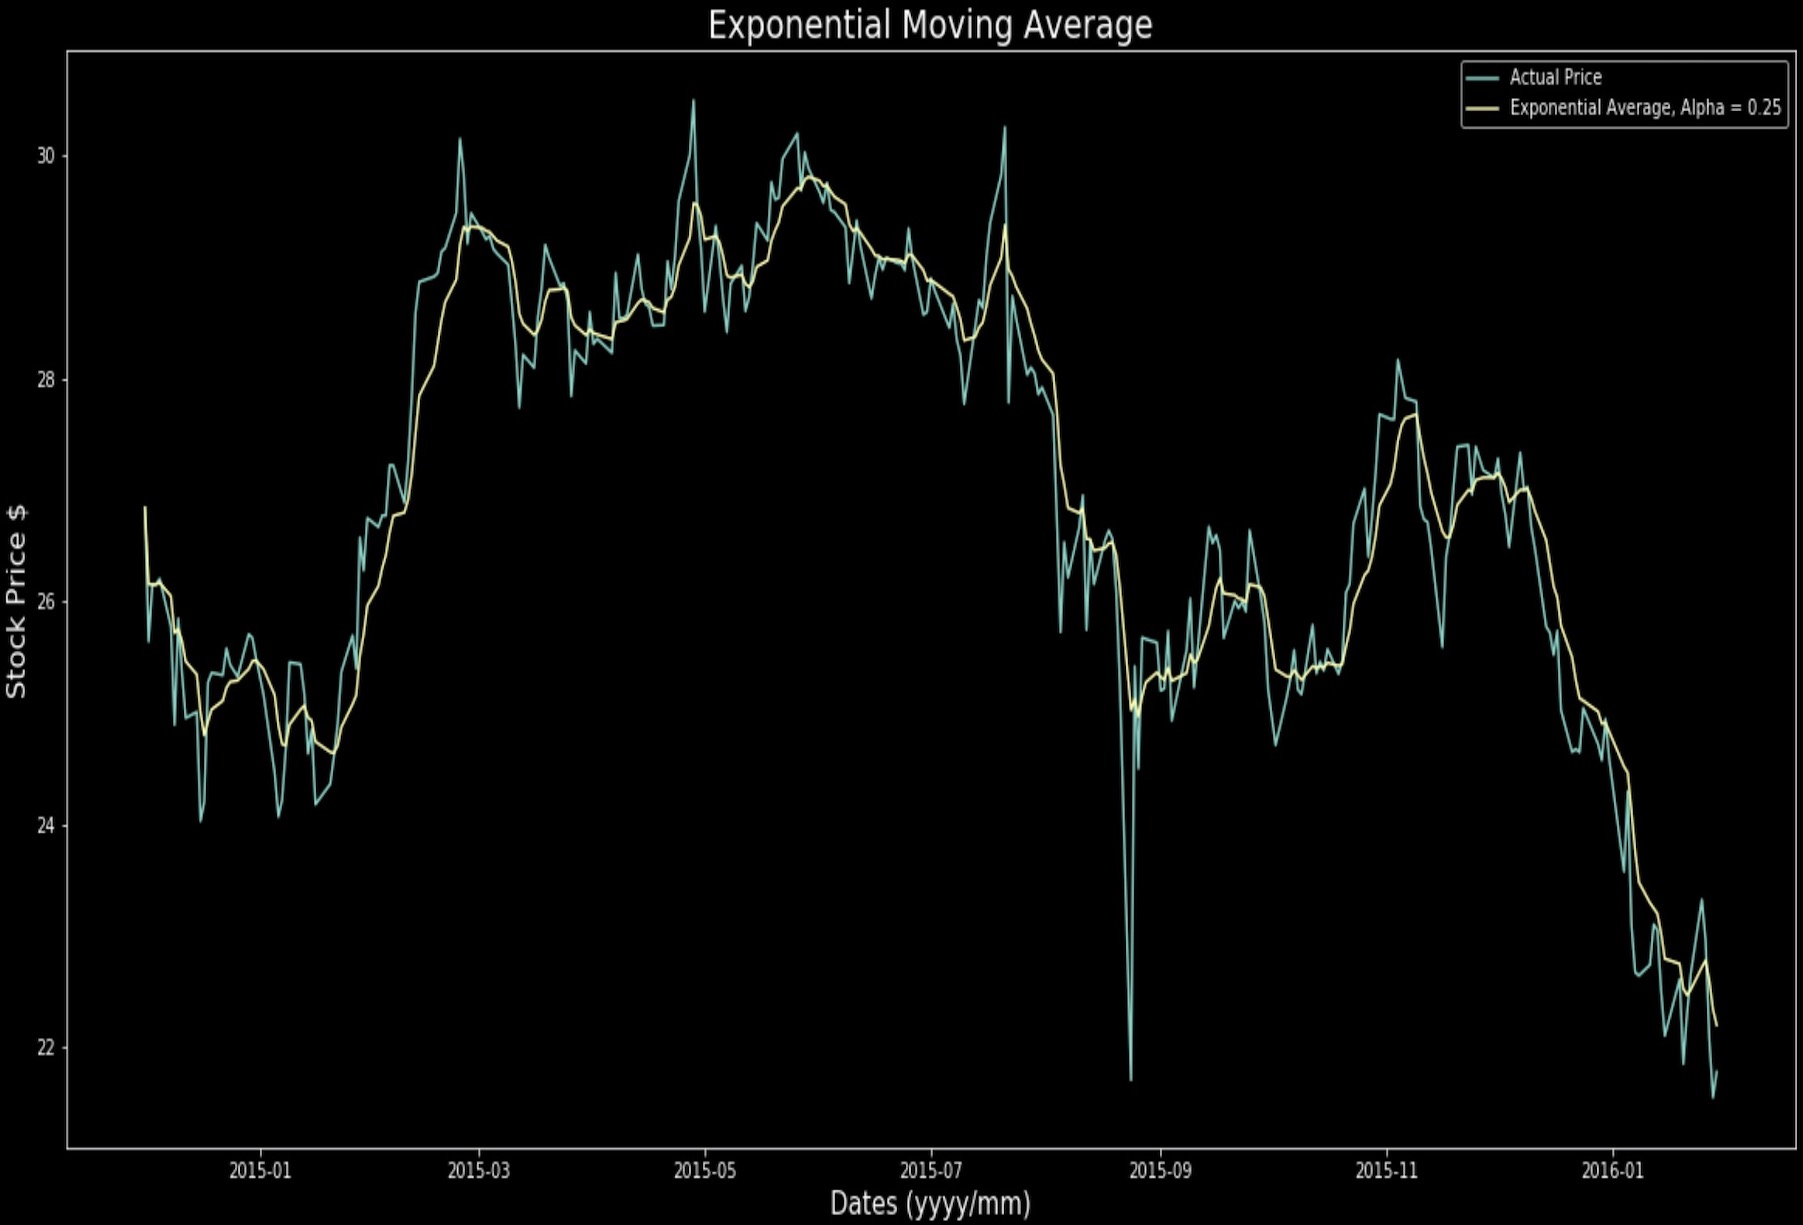
To find MACD we employed two types of exponential moving averages. The SMA (Simple Moving Average) is a moving average where we took the the first n days of the stock and averaged it. The EMA (Exponential Moving Average) is a moving average where we take the SMA and apply a smoothing component alpha. Using the smoothing average we give most recent stock prices a higher weight and more importance. Finding resistance and support was done by running a peak/valley algorithm that finds all local/global minima and maxima. Then we run an algorithm to find all the buckets inside which the local minima/maxima reside. After that we find all of the euclidean distances for the resistance and support. All other features fed into the RNN are fed directly as raw numbers from the YahooFinance initial dataframe extracted from the YahooFinance suite.
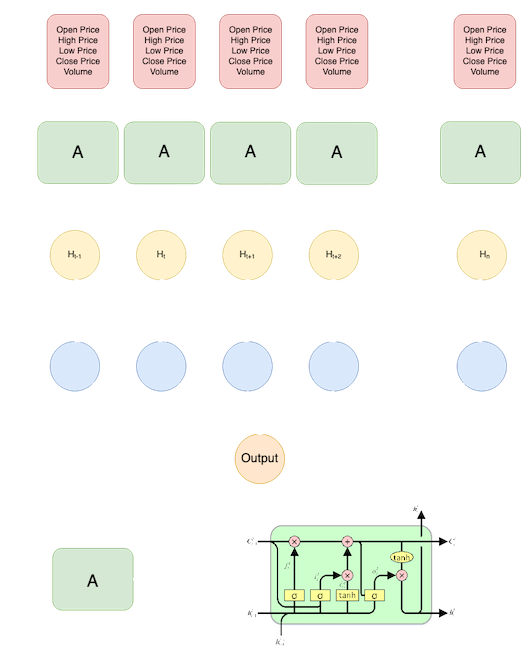
For the architecture of our model, we have designed a Recurrent Neural Network. We chose an RNN with a hidden Long Short Term Memory (LSTM) layer as research has shown that these perform particularly well on time series data such as stock prices. The network itself consists of an LSTM layer with 100 nodes followed by a fully connected Linear Layer which reduces the 100 nuerons to a single output.
To train the model, we update the weights in the Network through Backwards Propogation which utilizes a Mean Squared Error (MSE) loss function. Before training happens, we split all of the data pertaining to a stock into training and testing sets. The training set is then further broken down into batches that each hold 21 days of sequential data. Once we have the batches, we implement a feed forward algorithm that passes a single batch through the network. Once the network produces an output (in the form of a prediction for the High stock price on the day following the last day in the batch), a loss is evaluated as the Mean Squared Error between the models' prediction and the true High price of the stock on that day. With this loss, we are able to perform the backward propogation to update all of the weights in the model to make a more accurate prediction on future inputs.
All of the weights in the network are updated after each batch is passed through, a predicition is made, and a loss is established. One Epoch is completed once all of the batches have been through the network one time. We let the model continue to train for 150 Epochs. After training is complete, we then are able to test the accuracy of the model by splitting our allocated testing data set into segments of 21 sequential days. We again use forward propogation to pass a batch through the network and establish a loss in the form of MSE. During our testing phase, we no longer perform backward propogation and update the weights of the network. Instead we store the MSE from each batch and take a normalized average to arrive at a relative accuracy.


How we created Resistance and Support Buckets
Resistance and Support are two different measurements. Resistance defines an expected cap to the stock price, after which it is statistically driven to fall(based off previous resistance historic data). Support defines the expected bottom to the stock price for which it is statistically driven to rise(based off of support historic data). To learn more about how the algorithms were implemented to find these values, click "Learn More".

How we created Moving Averages
The SMA (Simple Moving Average) is a moving average where we took the the first n days of the stock and averaged it including the new days. The EMA (Exponential Moving Average) is a moving average where we take the SMA and apply a smoothing component alpha. To learn more about how the algorithms were implemented to find these values, click "Learn More"
Our RNN after being fed features: MACD, R&S, Volume, Open, Low, Close, High was able to correctly predict stock swings. Below you will find the graphs representing training data through the epochs, a loss graph, and a demonstration of a prediction against all features.
Please Click on Photos To Enlarge